

When I made the decision to purchase a personal weather station, and began to research my options, I was taken aback by the wide range of solutions that were available to choose from. Of course, by virtue of price alone, some solutions made that decision for me. I narrowed my list of possible solutions to hardware from Ambient, Davis, La Crosse, and Oregon Scientific. Considering quality, price, and the popularity of these solutions within the weather station community, I settled on the Davis Wireless Vantage Pro 2. At the time, I could not afford all of the bells and whistles for this station, but I was able to get the basic station that provides barometric pressure, humidity, precipitation, temperature, and wind data. The software to extract this data also presented a plethora of choices, but I ultimately chose WeatherLink.
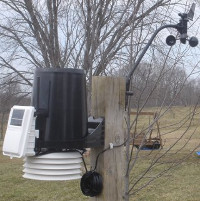
That was early 2008. It's now been over 8 years of constant operation, with little to no problems. The battery used to operate the station at night, when solar is not available, is the only component that has required replacement. The image of my weather station used on this page was taken just days after it's initial installation, it looks a little different today. After more than 8 years of enduring Indiana's cold and hot weather extremes, the station is beginning to show some wear. I plan to replace this station later this year, and I can guarantee you that its replacement will be another Davis station.
Now that you know about the actual weather station hardware, let me give you a glimpse of computer hardware and software that enables us to present this data on the web. While my setup is most definitely an overkill, and in no way represents the requirements to run a Davis station, it does suit my needs.
WeatherLink is responsible for collecting the weather data, which it stores in data files. In a basic implementation, this data can be exported as both text files and images for use on a web site. In fact, for the first several years, this is what enabled us to display weather data on this site. As time went on, however, we wanted more flexibility in the way the data was presented. This meant we needed a way to store the data in a mysql database. Being very pleased with WeatherLink, I sat out to code a solution that would work with WeatherLink to export the data to a mysql database. My solution, wx2sql, is a java-based multi-platform program that can do just that. In addition, wx2sql monitors these data files for changes, in order to keep the database updated with the latest observations. wx2sql is now running in my environment, providing up to date weather observation data. After further data validation and optimization, I plan to offer wx2sql as a download for those that may be interested. If you would like more details on wx2sql, click on the 'Software' page on this site.
With WeatherLink, the folks at Davis provide a file layout document that was essential to developing wx2sql. Also, their support team was very willing to answer a couple of questions that I had in regards to the file layout. I want to say thank you to these guys. In addition to the quality of their products, this type of support and openness is what will make me a repeat customer.
Within WeatherLink, the Archive Interval setting gives you the ability to set how often weather observations will be recorded. These options range from every one minute all the way up to every two hours. The lower the interval setting, the more settings will be recorded, and that results in higher storage requirements. Our weather station has been configured to record observations every minute since the turn-up date early in 2008. This setting enables us to record up to 1440 observations per day, or over 520,000 observations per year. This may sound like it takes a lot of space, but that is not the case. For a years worth of data, only ~50MB is required.
Below is a summary table of all of the observations recorded on our weather station since 2008. Included in this table are the total number of observations for that year, high and low temperatures, high and low barometer readings, total annual rainfall, and the highest wind speed. If you have any questions about our setup, systems, or data provided here, feel free to contact us via our Contact page.
| Year | # of Observations | Hi Temp | Lo Temp | Hi Barometer | Lo Barometer | Total Rainfall | Hi Wind Speed |
|---|